Brexit Effect? The Polish and Romanians become the leading non-UK nationalities, while Indians fall to the fourth place after the Irish
The Office of National Statistics revealed that there are now more Romanians living in the UK than Irish or Indians.
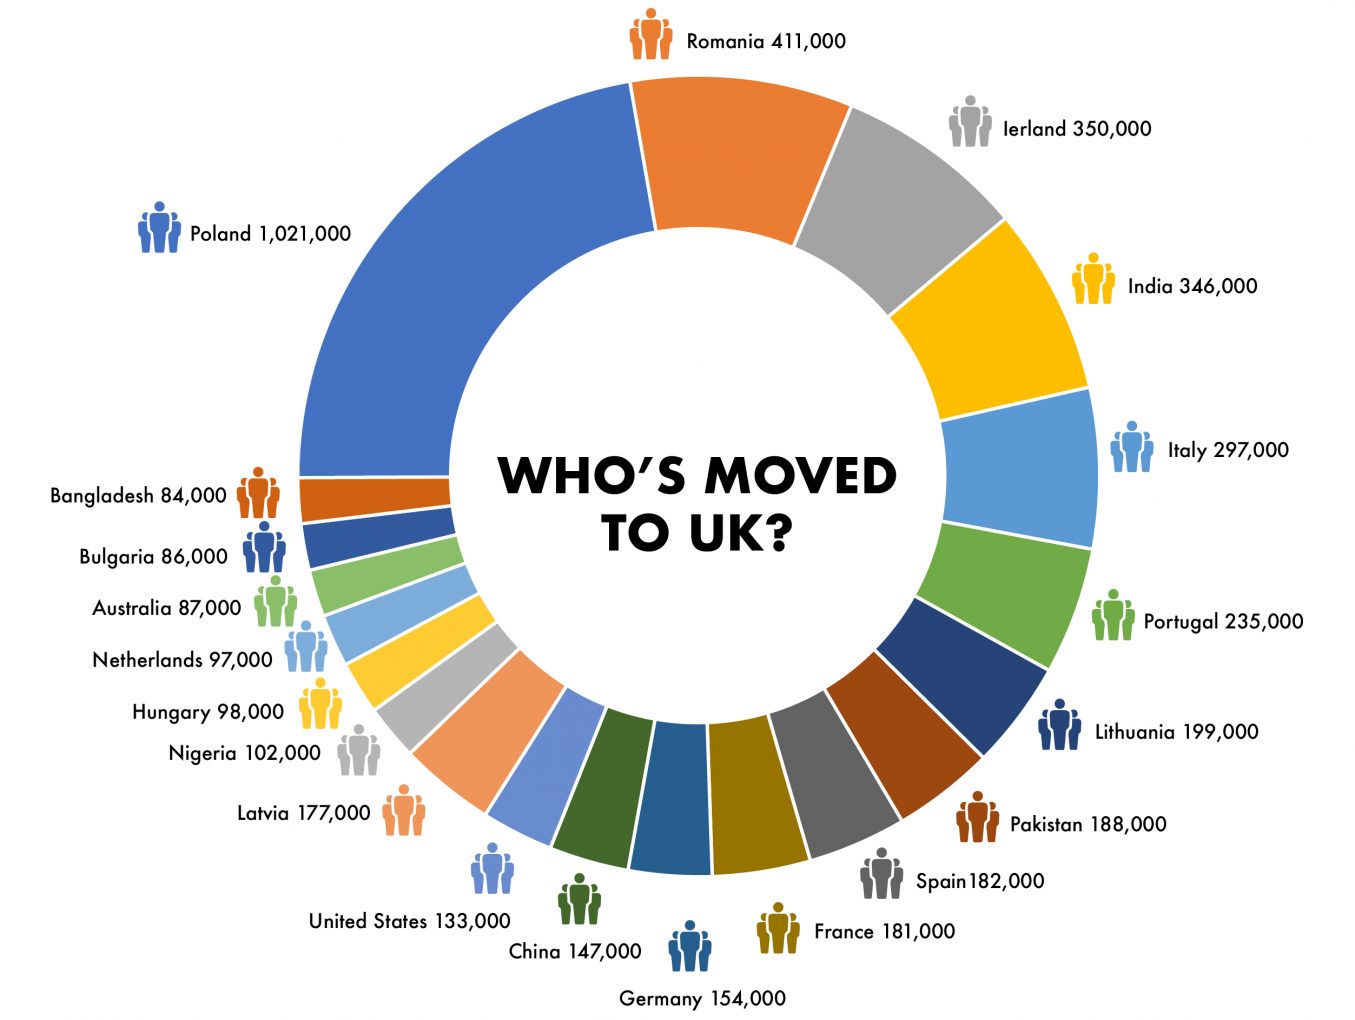
The number of Romanian nationals living in the UK in 2017 was estimated to be 411,000 – a jump of 25% from the previous year – the largest increase recorded by any country. Poland still remained the most common non-UK nationality, with over one million people living in the UK. Republic of Ireland was in the third place with 350,000 nationals followed by India with 346,000.
Since the reporting began in 2004, the non-UK population – both those who are born abroad or are not British nationals has increased every year.
Of the 65,176,000 people in the UK, 6.2 million were non-UK nationals, that is an increase of 4% and the number of people living in the UK and born abroad is 9.4 million, which is a 3% increase since 2016.
Commenting on the statistics, Here and Now 365‘s Managing Director, Manish Tiwari said: “A large amount of migration is skills based – and this is only possible from nationalities who are willing to move for better prospects. It is a delicate balance, which our immigration policy needs to maintain, so that Britain continues to flourish as a diverse and vibrant economy and doesn’t fall short of basic human skills.”
The increase can be attributed to Brexit with 3.8 million non-UK nationals, ie 61% are from the EU. The number of applications by EU nationals for UK citizenship doubled to 40,000 in the last 12 months and the number who were issued permanent residence cards rose to 168,000.
Romanians continued coming to the UK to work and earn more than what they would in their home country, however, the number of EU nationals seeking employment seems to have reached a standstill, with registrations for national insurance numbers in the last 12 months till March 2018 being down by 20% from the previous year.
London has the highest proportion of non-UK born and non-British national residents at 38% and 24% respectively. When broken down by local authority, London accounts for all five of the top spots.
| Country of birth | Nationality | |
| 1. Newham (57%) | 1. Newham (38%) | |
| 2. Brent (53%) | 2. Westminster (36%) | |
| 3. Westminster (53%) | 3. Brent (34%) | |
| 4. Hounslow (50%) | 4. Hounslow (33%) | |
| 5. Harrow (50%) | 5. Kensington and Chelsea (32%) | |
| Source: Office for National Statistics |
Here and Now 365 has always prided itself for promoting multiculturalism and celebrating the ethnic diversity of the UK.